
Every company has products that contribute the lion's share to success, and others that operate more in the background. But how do you identify these systematically to deploy resources optimally? The ABC analysis based on revenue relevance offers a proven method to examine your product portfolio and make strategic decisions on a solid data foundation. It supports you in optimizing your processes and contributes significantly to efficiency improvement and cost optimization.
ABC Analysis by Revenue Relevance: How to Control Your Success
The ABC analysis is a proven business analysis method that systematically divides products, customers, or product groups into A, B, and C categories based on their cumulative revenue relevance. The goal is to make visible which few items generate the majority of total revenue (Pareto principle) in order to align management, marketing, and assortment decisions strategically with the economically most important revenue drivers.
Checklist and step-by-step instructions in the article!
- A Products: The most important revenue drivers (approximately 80% of revenue through approximately 20% of products).
- B-Products: Moderately important products with stable revenue contribution.
- C products: Less important products with low sales share, so-called "slow movers".
The objective: Maximize focus on A-products, optimize B-products and minimize effort for C-products to strategically control your product management.
What exactly is ABC analysis with significance for revenue, profit, sales and margins?
The ABC analysis is a method for prioritization. It helps you distinguish the essential from the non-essential. Although it is applied in many areas such as procurement, inventory management, and customer management, its impact is particularly strong in the context of revenue relevance. Here, you rank your products not by intuition, but based on their concrete contribution to total revenue.
The theoretical foundation for this is provided by the Pareto principle, also known as the 80-20 rule. This states that often 80% of results are achieved with only 20% of total effort. Applied to your product range, this means: a small portion of your products is responsible for a large portion of your revenue. The ABC analysis makes precisely this distribution visible.
ABC analysis
Classification by Value Contribution • Pareto Principle (80/20)
Small quantity but highest value contribution. Intensive monitoring & inventory planning required.
⚡ Highest priorityMedium share with moderate value contribution. Regular monitoring with standardized processes.
📊 Medium priorityHigh quantity with low value contribution. Simplified processes & low capital commitment.
✓ Low PriorityABC Sales Analysis as a Graphic Download (jpg)
From Theory to Practice: The Three Product Classes
The classification into classes A, B and C is the core of the analysis. While the exact percentage values vary from company to company, the following guidelines have become established in practice.
A-Products: Your Stars in the Portfolio
These products are your absolute top performers. They form the smallest group, but generate the largest share of revenue.
- Sales share: approx. 70–80 %
- Quantity share: approx. 10–20 %
- Significance: These products secure your core business. Any decision affecting these items has significant impact. They deserve highest attention in marketing, sales, and inventory management.
B-Products: The Stable Middle Ground
B-Products are important, but not as critical as A-Products. They contribute solidly to revenue and form the backbone of your assortment.
- Sales share: approx. 15–25 %
- Quantity share: approx. 30–40 %
- Significance: Here lies optimization potential. Can some of these products be elevated to A-products through targeted measures? Regular review is worthwhile here, and process automation is often already possible.
C-Products: The Numerous Followers
This category comprises the largest number of products, but its contribution to total revenue is marginal.
- Sales share: approx. 5–10 %
- Quantity share: approx. 50–60 %
- Significance:C-products often tie up disproportionate resources in storage, administration and management. Here it is important to radically simplify processes or even consider assortment rationalization.
Practical Example: ABC Analysis in Practice
A mid-sized e-commerce company implemented the ABC revenue analysis and found that 18% of listed items generated almost 82% of revenue. After targeted assortment optimization and concentration of advertising measures on the identified A-products, inventory costs fell by 20% and logistics efficiency was significantly improved. Through a dynamic combination of product management and consistent optimization, revenues from B-products were also increased by using targeted marketing activities and bundling.

Typical Errors and Challenges in ABC Analysis
Although the ABC analysis is a simple concept, there are some pitfalls in practice:
- Incomplete or incorrect data basis: Inaccurate revenue figures, missing article numbers, or outdated product master data distort the result.
- Overly rigid class boundaries: The classification should be flexibly adapted to the individual business context.
- One-sided focus on revenue: Essential KPIs such as contribution margin, margin, or inventory turnover are often not considered – here, combining with other analysis methods offers advantages (see below).
- Neglecting seasonal effects: Fluctuations in sales from seasonal products can distort the picture.
- Measures not derived: Mere categorization is not sufficient – what matters is the consistent implementation and tracking of measures.
Advanced Analysis: Combination with XYZ Analysis
To enhance the validity of the ABC analysis, it can be linked with the XYZ analysis. While the ABC analysis classifies products by their revenue share, the XYZ analysis evaluates the regularity or predictability of demand. The combination results in a matrix that supports the following types of actions:
- AX Products: High sales and consistent demand → always keep in stock.
- CY products: Low sales, fluctuating demand → minimize inventory or review delisting.
This combined approach enables even more targeted cost optimization and provides product management with additional control certainty.
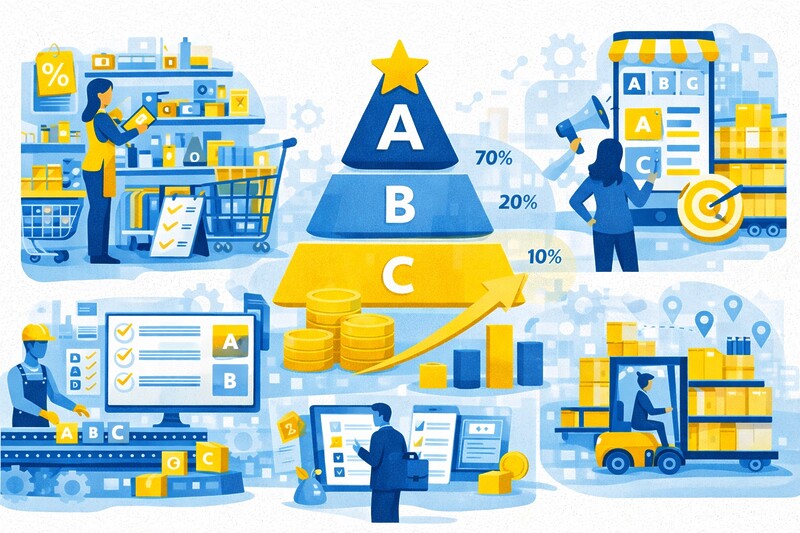
Industry Examples: How ABC Analysis is Applied
The practical application of ABC Analysis is versatile:
- Retail: Optimize assortment, reduce slow-moving items.
- Industry & Production: Control of production depth, selection of strategic suppliers.
- E-Commerce: Dynamic online product placement, targeted promotions.
- Service: Prioritization of customer projects or resource management.
- Wholesale: Improvement of warehouse logistics and route planning.
The method is industry-independent and relevant for any organization in which many different products or customer groups must be managed.
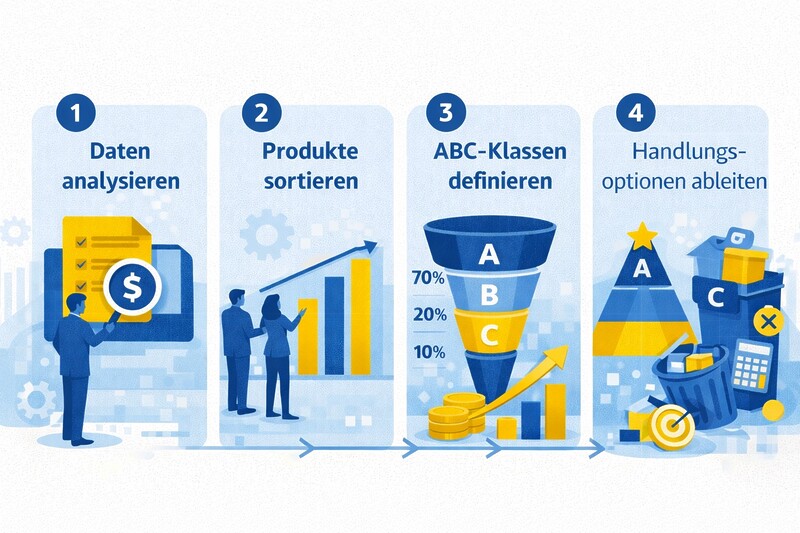
How to Conduct an ABC Analysis (Step by Step)
Performing an ABC analysis is straightforward and can be implemented with common spreadsheet applications such as Excel or specialized business intelligence tools.
- Collect data: Create a list of all your products or article numbers. Record for each product the revenue achieved within a defined period (e.g., the last 12 months).
- Sort by revenue: Sort the list in descending order by revenue. The product with the highest revenue is at the top.
- Calculate revenue share: Calculate for each product the percentage share of total revenue. (Formula: Product revenue / Total revenue × 100)
- Cumulate values: Add the percentage revenue share from top to bottom. The first product has its own share, the second has its own plus that of the first, and so on. The last line must 100 % result.
- Define classes: Set the boundaries for your A, B, and C categories. A typical classification is:
-
- A products: All products that together account for up to 80% of cumulative sales.
- B products: All subsequent products that reach up to the 95% mark of cumulative sales.
- C-Products: The remainder that accounts for the last 5% of revenue.
- Derive measures: Analyze the results and derive concrete strategic actions for each category.
Tip: For presentations, rely on interactive dashboards or dynamic charts in your BI software so that you can present your results clearly and flexibly to stakeholders.
Terms You Should Know
Although ABC analysis by revenue relevance is very precise, you will encounter various terms in practice. It is helpful to be familiar with them:
- ABC Analysis: The general standard term in business administration.
- ABC revenue analysis: Emphasizes that revenue is the basis for analysis (and not, for example, contribution margin or order quantity).
- Pareto analysis: Often used synonymously, but strictly speaking describes the underlying principle rather than the method itself.
- Product Portfolio ABC or ABC Assortment Analysis: Specific terms that focus on product classification and assortment optimization.
Regardless of the designation, the objective remains identical: to concentrate your efforts on the most profitable areas of your business.

Strategic Potential of Product Classification
A practical and illustrative tool for visualization of ABC analysis results is the Lorenz curve. This graphical representation shows at a glance how concentrated revenues are distributed across your assortment. On the x-axis, the cumulative share of products (from highest-revenue to lowest-revenue product) is plotted, and on the y-axis the cumulative revenue share. If the curve rises only slightly at first and then steeply later, your revenue is heavily concentrated on a few products – a typical scenario where the Pareto principle applies. The Lorenz curve helps you visualize the classification into A, B, and C products and use it effectively in presentations or meetings. This allows you to identify optimization potential and areas for action at a glance.
To make the classification of product categories even clearer, you will find below a table with the key characteristics of each class:
| Category | Typical revenue share | Typical quantity share | Strategic importance |
|---|---|---|---|
| A-Products | approx. 70–80 % | approx. 10–20 % | Revenue drivers with highest priority for focus and control |
| B-Products | approx. 15–25 % | approx. 30–40 % | Optimizable Products with solid contribution to overall success |
| C-Products | approx. 5–10 % | approx. 50–60 % | Long-runners where process simplification makes sense |
The ABC analysis is far more than a mere statistical exercise. It is a strategic tool that helps you make informed decisions and increase efficiency across various business areas such as product management, procurement, and inventory management.
- Procurement and Purchasing: Concentrate your negotiating power on suppliers of A-products. Secure the best terms and high delivery reliability there. For C-products, you can instead rely on standardized processes and less intensive supplier relationships.
- Inventory Management: Place A-products in easily accessible locations in the warehouse to reduce picking times. Conduct regular and accurate inventory checks for these items. For C-products, larger safety stocks and less frequent checks are often sufficient.
- Marketing and sales: Promote your A-products prominently. Invest the majority of your marketing budget in the items that generate the most revenue. For B-products, targeted campaigns can be worthwhile to unlock their potential.
- Assortment policy: The analysis provides a clear basis for deciding which products should be removed from the assortment. C-products that incur high storage costs and generate little revenue are the first candidates for discontinuation.
Conclusion: More focus, more success
The ABC analysis by revenue relevance is a simple yet extremely powerful tool for increasing your operational efficiency. It forces you to view your product portfolio not as a homogeneous mass, but as a differentiated landscape of champions, solid workhorses, and resource-intensive followers.
FAQ on ABC Analysis
What are the most important advantages of ABC analysis?
With ABC analysis, you quickly identify which products or customers generate the most revenue. You can deploy your resources more strategically, optimize processes and increase efficiency. This leads to better cost control and greater profitability.
What are the limitations and constraints of ABC analysis?
ABC analysis typically considers only one metric (e.g., revenue). Other relevant factors, such as contribution margin, quality characteristics or fluctuations in demand, are not taken into account. It is advisable to combine it with further analyses (e.g., XYZ analysis).
How often should you perform ABC analysis?
Regular repetitions – for example, annually or semi-annually – are advisable to respond to market changes or new assortment developments.
How can the ABC analysis be adapted for different industries?
In retail, a product-based analysis is recommended. Service companies benefit from customer classification by revenue or order volume. Manufacturing companies often combine the analysis with inventory turnover frequency. It is important to set class boundaries specific to your company and to select the relevant key metrics.
Can ABC analysis be automated?
Yes, many ERP and BI tools enable automatic execution and visualization. Interactive dashboards also help present and evaluate results dynamically.
What should I do if products suddenly shift into a different category?
Analyze the causes – such as seasonal effects, assortment changes, or price adjustments – and adjust your measures flexibly.
—By directing your attention, capital, and labor strategically toward A-products, you optimize the deployment of your resources and create the foundation for sustainable growth. Use the insights gained to streamline processes, reduce costs, and sharpen your strategic direction.

Checklist: Your Next Steps for ABC Analysis
- Define data basis: Establish the analysis period (e.g., the last 12 months).
- Export data: Pull a list of all products with their respective sales from your ERP or shop system.
- Perform analysis: Use a spreadsheet to sort products by revenue, calculate shares, and cumulate them.
- Define class boundaries: Define clear threshold values suitable for your company for A, B, and C products (e.g., 80% / 95% / 100%).
- Visualize results: Create a chart (e.g., a Pareto curve) or use interactive dashboards for dynamic presentations.
- Schedule strategy workshop: Discuss the results with your team (sales, marketing, procurement, logistics).
- Create action catalog: Derive concrete and measurable action instructions for each product category.
- Which products are currently causing the highest storage costs and which ABC category do they fall into?
- Are there products that could move up to the A category through additional marketing measures or assortment restructuring?
- How often must class boundaries be reviewed to respond to market or seasonal effects?
- How can your company use the results of the analysis for long-term efficiency improvement and cost optimization?
- Monitor implementation: Implement the defined measures and verify their effectiveness at regular intervals.
- Repeat analysis: Plan regular repetition of the ABC analysis (e.g., annually or semi-annually) to respond to market changes.
Use the ABC analysis by revenue relevance strategically to take your product management, your efficiency improvement, and your cost optimization to the next level!

Florian Ibe
CEO & Marketing Consultant
Your contact person: Florian Ibe




 DE
DE