
Advertising metrics often sound similar but lead to very different control decisions in marketing. If you are looking for the right lever for your e-commerce business, you should not confuse ROAS, POAS, and ROI. We will show you with a concrete numerical example which metric provides the reliable answer when.
Understanding and correctly applying ROAS, POAS, and ROI in marketing
What does ROAS mean and how do you calculate it?
The Return on Ad Spend, or ROAS for short, is probably the best-known performance metric in online marketing. It describes the relationship between the revenue generated by an advertising measure and the advertising costs incurred for it. At VASTCOB, we see ROAS in almost every customer dashboard because all relevant advertising platforms display it directly.
The formula is simply: ROAS equals revenue divided by advertising costs. It is common to present it as a ratio, such as 4 to 1, or as a percentage of 400 percent. If you invest 1,000 euros in Google Ads and generate 5,000 euros in revenue from it, the result is a ROAS of 5.0 – an attractive advertising performance at first glance.
In practice, advertisers use ROAS for a quick evaluation of campaigns and ad groups, for example, in the daily work of an SEA agency via Google Ads, Bing Ads, or Meta Ads. Its strength lies in its direct availability within the platforms. Its weakness: ROAS ignores important cost items such as cost of goods sold, returns, or shipping. A high ROAS therefore does not necessarily mean a profitable advertising channel.
Why POAS is the more important metric for e-commerce companies
The Profit on Ad Spend, abbreviated POAS, is the next level of performance metrics. Instead of just looking at pure revenue, POAS relates gross profit to advertising costs. This reveals what actually remains of the advertising-generated revenue after the cost of goods sold and direct sales costs.
The calculation is: POAS equals gross profit divided by advertising costs. Unlike ROAS, real margin structures are factored in here. A POAS of 1.2 means that every euro of advertising spend generated 1.20 euros in gross profit – so the advertising channel actually contributes to profit. A POAS below 1.0, on the other hand, shows that the campaign is loss-making, even if the ROAS looks positive.
POAS typically takes into account merchandise purchasing, return rates, shipping and packaging costs, and payment service provider fees. This makes POAS significantly closer to the actual business success of an online shop than pure ROAS. However, the prerequisite is clean margin tracking at the product level, which many mid-sized e-commerce companies still need to build up.
ROI as a holistic return metric
The Return on Investment, or ROI for short, is the overarching profitability metric in business administration. Unlike ROAS and POAS, which focus purely on advertising spend, ROI considers the entire investment in relation to the profit achieved. It is therefore used not only in marketing, but also in investment decisions, strategy evaluations, and controlling.
The classic formula is: ROI equals profit minus investment costs divided by investment costs. The result is usually expressed as a percentage. If you invest 100,000 euros in a marketing campaign and generate 130,000 euros in profit from it, the ROI is 30 percent. The key difference from ROAS and POAS is that ROI includes all relevant costs, meaning personnel, tools, overhead, and advertising spend.
For management and controlling, ROI is often the ultimate truth, because it provides the big picture. Operational marketing teams, on the other hand, need shorter-term control metrics like ROAS and POAS in order to react on a daily basis. The limitation of ROI is that it is hardly suitable for real-time optimization of individual campaigns, because many of the costs it includes are only fully captured on a quarterly basis.
Become more visible on Google & Social Media?
In a free strategy consultation for data-driven online marketing, we uncover your untapped potential, review any existing ad accounts if necessary, examine your SEO ranking and visibility, and determine which strategy is appropriate for your budget and which active measures will lead to more inquiries or sales.

✅ More visibility & perception through targeted placement
✅ More visitors > prospects > customers > revenue
✅ Reach target groups scalably with SEA
✅ Act and grow sustainably with SEO
🫵 Maximum success with our hybrid strategy
💪 More than 15 years of experience across industries in over 1,000+ projects demonstrable!







ROAS, POAS, and ROI compared directly
Three metrics, three perspectives, three levels of control – the following table contrasts the key differences. In the customer dashboards that we set up for advertisers, these three metrics are therefore usually visible side by side.
| Metric | Formula | Measures | When useful | Weakness |
|---|---|---|---|---|
| ROAS | Revenue / Ad spend | Ad revenue efficiency | Real-time campaign evaluation | Ignores margins, returns |
| POAS | Gross profit / Ad spend | Ad profit efficiency | Margin-driven control | Requires clean margin tracking |
| ROI | (Profit − Investment) / Investment | Total return | Investment decisions | Longer timeframe required |
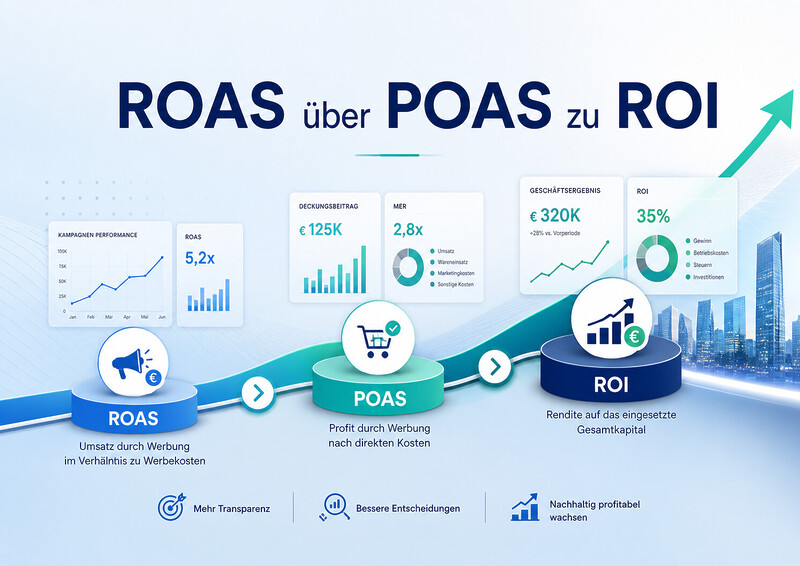
A high ROAS initially only indicates that advertising revenue looks good relative to advertising costs. Only POAS checks whether this is also profitable. And ROI assesses whether the entire investment, including personnel costs, tooling, and overhead, has paid off.
In practice, we recommend that e-commerce advertisers consider all three metrics in parallel. Those who optimize only for ROAS risk low-margin sales. Those who measure only ROI lose campaign agility. POAS brings both worlds together, provided the underlying data is properly maintained.
An e-commerce practical example shows the differences in numbers
Imagine a mid-sized online shop for sportswear with a monthly advertising budget of 10,000 euros for Google Ads and Meta Ads. Across all channels, the shop generates 50,000 euros in advertising revenue in a typical month. From over 10 years of performance marketing experience, we can say that we regularly see exactly this constellation with e-commerce clients.
Sample calculation for sportswear shop per month
| Item | Amount |
|---|---|
| Advertising budget (Google Ads + Meta Ads) | €10,000 |
| Advertising revenue | €50,000 |
| − Cost of goods, returns, shipping, packaging | −€38,000 |
| = Gross profit | €12,000 |
| − Personnel, tools, overhead (allocated) | −€5,000 |
| = Profit | €7,000 |
Key figures calculated from this
| Metric | Calculation | Result |
|---|---|---|
| ROAS | €50,000 / €10,000 | 5.0 |
| POAS | €12,000 / €10,000 | 1.2 |
| ROI | €7,000 / €10,000 | 70% |
A ROAS of 5.0 initially appears outstanding – but the POAS of 1.2 shows that the campaign is only just above the profit threshold. This is the typical profit trap that we warn our clients about. If the shop were to optimize more aggressively for ROAS in the next step and push low-margin promotional products in the process, the POAS could quickly fall below 1.0, even though the ROAS continues to rise. The consequence for conversion optimization is clear: instead of blindly targeting advertising revenue, the focus should be on higher-margin product groups and lower return rates.
Which metric you should use as a control variable and when
For daily campaign management in Google Ads, Meta Ads, or other advertising platforms, ROAS is indispensable. It provides real-time feedback on which ads, keywords, or target audiences are working. This makes it particularly suitable for day-to-day operational work – adjusting bids, pausing weak ads, scaling successful campaigns.
POAS belongs at the weekly management level. It answers the question of whether the advertising budget actually generates profit – not just revenue. In a professional performance marketing agency, POAS is therefore the central control variable between the marketing team and management. The prerequisite is that the margin data is properly stored in the tracking setup.
ROI belongs at the monthly or quarterly reporting level. Here, the assessment is whether the entire marketing mix of personnel, tools, advertising, and external service providers adds up overall. ROI is the metric for investment decisions. Should we increase the advertising budget? Is a new channel worth it? ROAS alone cannot answer these questions.
Common mistakes when interpreting metrics
From our many years of practice, we know the typical stumbling blocks where advertisers fail when interpreting ROAS, POAS, and ROI. Most mistakes arise less from the formulas themselves and more from poor data quality or mixed time horizons.
The five most common mistakes at a glance:
- Interpreting ROAS without margin context and thus creating profit traps.
- Calculating POAS based on estimated margins instead of clean product margin tracking.
- Calculating ROI without clear cost demarcation and leaving unclear what counts as an investment.
- Mixing key figures from different tools without aligning the data models, e.g., Google Ads versus shop system versus accounting.
- Confusing time horizons because the real-time ROAS of a single campaign is not comparable to the quarterly ROI.
Anyone who avoids these five mistakes gains an honest view of their advertising performance. The investment in a clean data basis – clean tagging, correct conversion tracking, a clean margin model – pays off many times over. At first glance, this seems like an effort, but in practice, it is the prerequisite for performance indicators to allow reliable control decisions at all.
Implementing the right performance indicators cleanly with VASTCOB
At VASTCOB, we manage advertising accounts from startups to corporations and integrate ROAS, POAS, and ROI into uniform dashboards. From over 10 years of performance marketing experience, we know that most optimization potentials do not lie in individual ads, but in the key figure architecture behind them.
As a Google Partner and Meta Business Partner, we know the data sources first-hand, and as a SEO Top 100 Agency, we understand the connection to conversion optimization. Our e-commerce expertise helps clients map their margin structures in such a way that POAS control actually works. Consulting with implementation competence means for us: We don’t just conceptualize, we actually set up the tracking infrastructure.
If you are looking for a clean KPI architecture for your performance marketing, we can help you. As part of an Online Marketing Coaching, we will clarify together which KPI makes sense in which reporting step and how the tracking setup needs to be structured for it. Contact us for a non-binding initial consultation, we look forward to hearing from you.




 DE
DE