
Advertising success can be measured with a variety of key figures, but in practice, the same question always dominates: ROAS or ROI? While marketing teams like to work with ROAS, management prefers to look at ROI. This direct comparison shows why both perspectives are important at the same time and how you can combine them in a unified reporting.
ROAS vs ROI in direct comparison for performance marketing
What does ROAS mean and what does it measure?
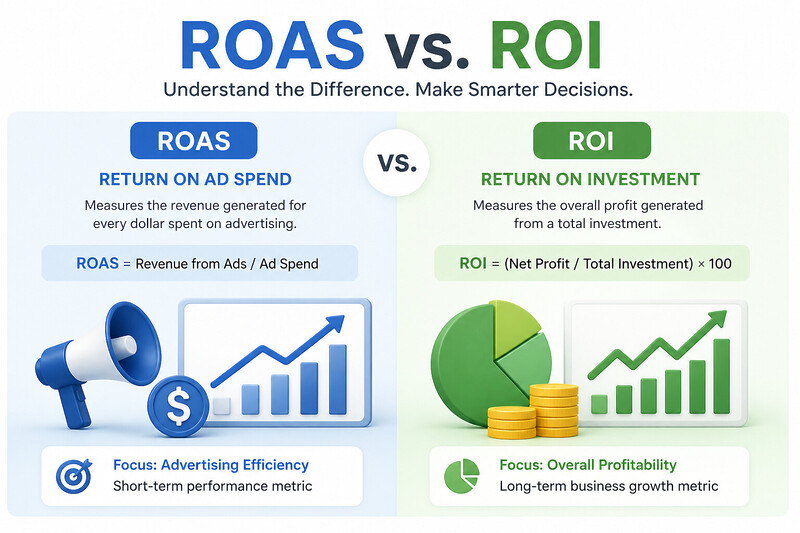
ROAS stands for Return on Ad Spend and describes how much advertising revenue is generated per invested advertising euro. This makes ROAS the key figure that is directly available in almost every advertising platform – from Google Ads to Meta to LinkedIn. At VASTCOB, we see ROAS in every campaign evaluation as the first indicator of advertising performance. It is the counterpart to the question of how efficiently a campaign converts the advertising budget into revenue.
ROAS is calculated as a simple division: advertising revenue divided by advertising costs. A ROAS of 4.0 means that every euro spent generated four euros in advertising revenue. The platforms provide the value in real time, which enables quick reactions to campaign performance. It is common to display it both as a ratio of 4 to 1 and as a percentage of 400 percent.
The strength of ROAS lies in its immediate availability and comparability. The weakness: It does not include cost of goods sold, personnel, or tooling costs. Anyone who optimizes exclusively for ROAS runs the risk of not clearly separating profitable from unprofitable campaigns. In a professional SEA agency, ROAS is therefore always interpreted in the context of other key figures.
What does ROI mean and what does it measure?
ROI is the abbreviation for Return on Investment and originally comes from business administration, not online marketing. At its core, this key figure answers the question of how much profit an investment of any kind has generated in relation to the funds invested. Applied to advertising expenses, ROI therefore considers not only the revenue generated, but also all costs that were necessary to generate this revenue.
The formula is: profit minus investment costs, divided by investment costs – the result is given as a percentage. An ROI of 50 percent means that an investment of 100,000 euros resulted in a profit of 50,000 euros. Unlike ROAS, all cost types are included here: advertising expenses, personnel, tools, hosting, overhead.
This completeness makes ROI the favorite metric of management and controlling. It shows whether a marketing activity was really worthwhile. However, the limit of ROI lies in the time horizon. Personnel costs and overhead often cannot be properly recorded until quarterly, which is why ROI does not support real-time decisions. For rapid campaign management, ROAS remains closer to day-to-day work.
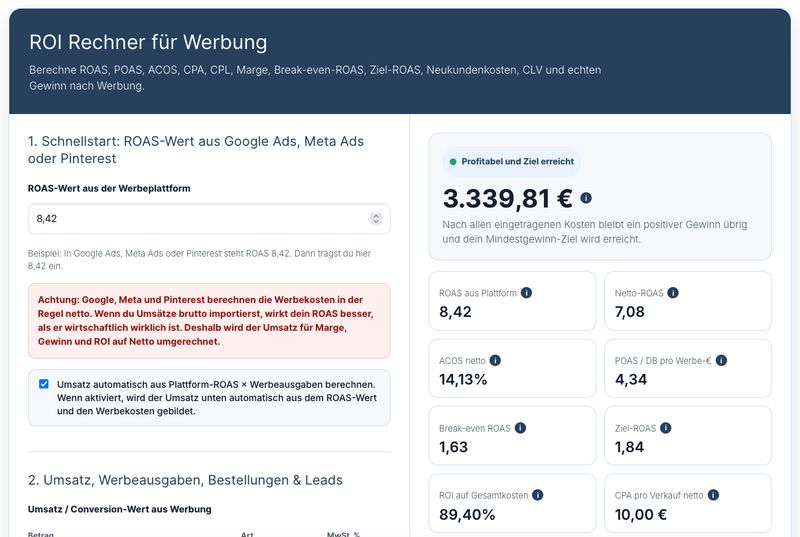
Recommendation: Be sure to use our ROI calculator!
ROAS and ROI compared directly
Anyone who places ROAS and ROI side by side sees two very different management logics. ROAS remains closely tied to advertising itself, while ROI opens up the perspective on the entire investment picture. The following table presents the key differences:
| Metric | Formula | Measures | Time Horizon | Primary Users |
|---|---|---|---|---|
| ROAS | Ad Revenue / Ad Spend | Ad Revenue Efficiency | Real-Time | Marketing Team |
| ROI | (Profit − Investment) / Investment | Overall Return | Weeks to Quarters | Executive Management, Controlling |
The central difference is not academic; it directly affects decisions. A campaign with a high ROAS can simultaneously have a low or even negative ROI – whenever margins, personnel, or tooling costs eat up the advertising profit. Conversely, a campaign with a low ROAS can contribute strongly to ROI in the long term, for example when it generates initial contacts that later become loyal customers.
Become more visible on Google & Social Media?
In a free strategy consultation for data-driven online marketing, we uncover your untapped potential, review any existing ad accounts if necessary, examine your SEO ranking and visibility, and determine which strategy is appropriate for your budget and which active measures will lead to more inquiries or sales.

✅ More visibility & perception through targeted placement
✅ More visitors > prospects > customers > revenue
✅ Reach target groups scalably with SEA
✅ Act and grow sustainably with SEO
🫵 Maximum success with our hybrid strategy
💪 More than 15 years of experience across industries in over 1,000+ projects demonstrable!






In practice, we recommend reporting both metrics in parallel. ROAS belongs on the daily marketing dashboard, while ROI belongs in the monthly or quarterly management reporting. Anyone who omits one of the two metrics is making decisions on an incomplete data basis.
ROAS alone is rarely enough – why ROI delivers the big picture
A high ROAS always sounds good at first. But in many advertising accounts that we take over at VASTCOB, we see the same effect: The platforms report ROAS values of 4.0 or 5.0, while management simultaneously signals that the marketing investments are not profitable on balance. The reason lies in the gaps that ROAS does not capture.
Personnel costs for campaign managers, licenses for tracking and reporting tools, allocated overhead costs of the marketing department – all of this flows only into ROI, not into ROAS. With smaller advertising budgets of up to 5,000 euros per month, the effect is manageable. With larger budgets and complex setups, the difference between the ROAS view and the actual return quickly adds up.
The difference becomes particularly clear in the B2B sector, for example with a SaaS provider with long sales cycles. Here, expensive initial contact is generated via LinkedIn, Google Ads, and content marketing, which only leads to contract signing after months. Anyone who looks only at ROAS in this constellation overlooks the real profit levers – conversion optimization along the entire customer journey, not just at the ad level.
Marketing reporting versus management perspective
From our reporting workshops with management teams, we know the conflict: The marketing team proudly reports rising ROAS values, while management wonders why profit at the end of the quarter is still below plan. The two sides talk past each other because they are looking at different data levels – without this difference being made transparent in shared reporting.
Marketing managers typically work in real time with platform data and steer at the campaign level. Management, by contrast, is interested in the result after all costs. This is not an oversight but a division of tasks. It becomes difficult when both sides ask the same question – is marketing worth it? – and give two different answers.
A professional performance marketing agency resolves this conflict through clearly separated reporting levels: operational reporting (daily ROAS, campaign adjustment), tactical reporting (weekly profit and margin analysis), strategic reporting (monthly ROI, quarterly strategy review). This way, each side gains its own perspective without the other side being obscured.
A B2B practical example shows the differences in numbers
Imagine a B2B SaaS provider that acquires new customers through LinkedIn marketing and Google Ads. The monthly advertising budget is 8,000 euros. Per month, this leads to an average of eight contract signings with an average first-year contract value of 6,000 euros – resulting in 48,000 euros in advertising revenue in the first year. From over 10 years of B2B performance marketing practice, we can say that this constellation is typical for mid-sized SaaS companies.
Example calculation for a B2B SaaS provider per month
| Item | Amount |
|---|---|
| Advertising budget (LinkedIn + Google Ads) | €8,000 |
| Advertising revenue first year | €48,000 |
| − Hosting, support, onboarding costs | −€9,000 |
| = Gross profit | €39,000 |
| − Personnel, tools, sales share | −€22,000 |
| = Profit | €17,000 |
Key figures calculated from this
| Metric | Calculation | Result |
|---|---|---|
| ROAS | €48,000 / €8,000 | 6.0 |
| ROI | €17,000 / €8,000 | 212.5% |
A ROAS of 6.0 seems like a top result for the marketing team. The ROI of 212.5 percent confirms that the investment was indeed profitable – however, this calculation includes 22,000 Euros for personnel, tools, and proportional sales costs. If these become invisible in an isolated marketing report, management feels blind towards their marketing team. This is precisely where a clean KPI architecture comes into play: both key figures side by side, with a clear definition of cost items.
Use the ROI Calculator to easily calculate Return on/of Investment
Three common mistakes when dealing with ROAS and ROI
From our consulting practice, we know recurring pitfalls in the application of ROAS and ROI. These errors usually arise not from ignorance, but from operational pressure or unclean data structures that are carried along in daily business.
The three most common mistakes at a glance:
- Considering ROAS in isolation without ROI plausibility. Marketing teams lose touch with business profitability because they work in platform views day in and day out.
- Deriving ROI from too few data points and making decisions too early. Especially for B2B campaigns with long sales cycles, ROI evaluation requires several months of data – otherwise, decisions are made based on incomplete figures.
- Mixing both key figures from different tools. If Google Ads, shop system, and accounting use different time or conversion models, ROAS from Tool A combined with ROI from Tool B does not provide a consistent basis for control.
Anyone who avoids these three mistakes gains a significantly more reliable data basis. The investment in a clean tracking infrastructure pays off many times over – both in the quality of control and in the trust between marketing and management.
Bridging the gap between advertising KPIs and corporate profitability with VASTCOB
At VASTCOB, we manage advertising setups of various sizes, from startups with manageable ad budgets to corporate mandates with complex reporting hierarchies. In all cases, the following applies: Only the clean connection of ROAS and ROI makes performance marketing reliably controllable. From over 10 years of experience, we know that most optimization potentials do not lie in individual ads, but in the reporting setup behind them.
As a Google Partner and Meta Business Partner, we have direct access to data sources. Our SEO Top 100 Agency award combines this with conversion knowledge across the entire customer journey. Consulting with implementation expertise means for us: We don’t just design a KPI concept; we actually set up tracking tools, dashboards, and reporting structures.
If you are looking for a unified key figure architecture where marketing and management speak the same language, we can support you. As part of an online marketing coaching, we clarify together which key figure is useful in which reporting step and how the tracking setup must be structured for it. Contact us for a non-binding initial consultation; we look forward to the exchange.




 DE
DE